
Geostatistical Seismic Analysis and Hazard Assessment for Israel
1. Methodology
This section outlines the methodological framework adopted for the analysis, starting with the preparation of intermediate products, followed by the creation of a comprehensive Seismic Hazard Zone Map (SHZM) for the State of Israel.
Figure 1: Seismic Hazard Zone Map (SHZM) model schema

1.1 Intermediate Products
1.1.1 Area of Interest (AOI) layer
To ensure consistency in weighted overlay analysis, all raster layers must share the same extent. Thus, a mask of the analysis area was created using a polygon layer of all countries' borders, obtained from the ‘ArcGIS Hub’ website. This mask focuses solely on the State of Israel's borders, serving as the AOI mask for subsequent 'extract by mask' operations on each produced intermediate raster layer.
1.1.2 Peak Ground Acceleration Map (PGA) raster
Historical earthquake records (from 1900 to 2020, totaling 921 records) were downloaded from the USGS earthquake catalog. These records were filtered through cluster-outlier and 'Hot Spot Analysis' tools to identify true earthquake clusters. Two raster layers were then created: a Euclidean distance raster and a magnitude map. Both were clipped to the AOI, and using a PGA attenuation equation, the PGA map layer was produced. (figures 2 and 3).
Figure 2: PGA equation used with raster calculator (left); PGA map raster, output of PGA steps SHZM model (right)

Figure 3: Modelbuilder schema of PGA layer

1.1.3 Fault Distance Raster
A polyline feature layer representing global fault lines was sourced from GitHub. A Euclidean distance raster for these fault lines was created and then clipped to the AOI. (Figure 4A).
1.1.4 Slope Map Raster
Utilizing a DEM file from the USGS website, a slope analysis was performed to generate a slope raster layer, which was subsequently clipped to the AOI. (Figure 4B).
1.1.5 Soil Map Raster
A polygon layer detailing northern and central Israel's geology/soil features was downloaded. This layer was completed for the entire country using digitization and various data sources. A raster layer for the ‘Drift Risk Level’ attribute was created and clipped to the AOI. (Figure 4C).
1.1.6 Join population data to Israel settlements records
Settlement data was obtained from the ‘Survey of Israel’ as a CSV file, converted to a table, and augmented with 2016 census population data from the Israeli Central Bureau of Statistics. This enhanced table was transformed into a point feature layer.
Figure 4: Intermediate products of the Seismic Hazard Zone project for the state of Israel: [A] Fault distance map; [B] Slope raster; [C] Soil drift risk level based

1.2 Final Products
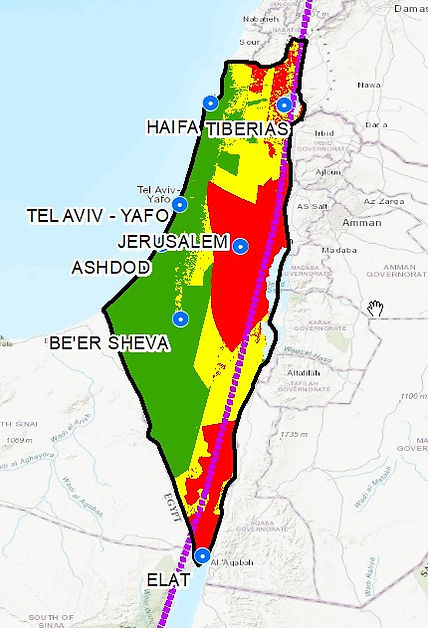
All four raster layers (PGA, Slope, Fault Distance, and Soil Map) were reclassified and ranked based on their respective values, with proximity to fault lines being a key factor in the ranking. A Weighted Overlay analysis yielded the SHZM, delineating areas into high, moderate, and low risk levels.
Figure 5: Israel Seismic Hazard Zone Map (SHZM)
To produce the relationship between Israel population, their settlements locations and the hazard zone risk level (seismic-wise) associated with that settlement location a ‘Extract Multi Values to Points’ tool was used on the SHZM raster and the settlements-population point feature layer. The hazard level was appended to the point feature layer of the settlement’s location and population data. Then aggregate statistics was applied using ‘Summary Statistics’ tool and a vertical bar graph was produced to show how many people are at what risk level.(Figure 6).
Figure 6: Israel population by Area risk level obtained from the SHZM layer
